Proposed Design
Proposed Design:
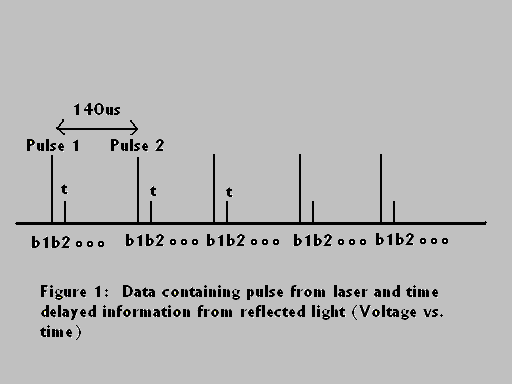
The design involves the organization of the data collected and taking the Fourier transform of the organized data to determine the frequency content. The data will contain pulses from the laser that happen every 140us. Between each pulse the data will be divided into bins by the program. Each bin will represent a certain distance away from the laser. The information between each pulse shows the field information gathered from the scattered light.
The solution to the problem involves the following:
1. Ask the user for desired inputs.
2. The data will be divided into bins according to each pulse
3. Bins will be organized according to range.
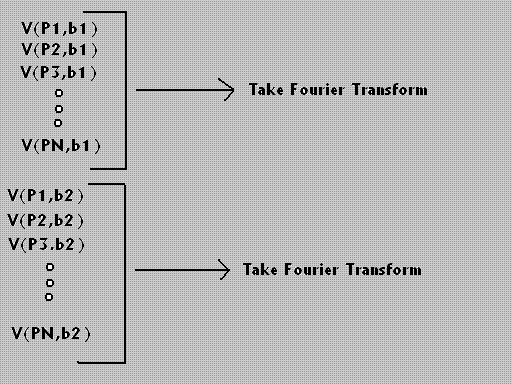
4. Discrete Fourier Transforms will be taken for each set of bins.

|
In Figure 1,
t -> time of delay for light reflected back from object
Pulse 1 -> First pulse of laser
Pulse 2 -> Second pulse of laser
Pulse 3 -> Third pulse of laser
b1 -> bin representing a certain distance from laser
b2 -> bin representing a distance from laser father than b1
The distance from the laser to the object reflecting light back to the optical sensor is determined by the following equation:
Distance = C*t/2
Where C is the speed of light (constant) and t represents the time delay between the laser�s pulse and the optical sensor�s detection of reflected light.

|
All of the bins will be grouped as seen above. Each group now represents data taken at a particular distance away from the laser. The figure below represents what this grouped data should look like if a bee is present.

|
The Sliding Discrete Fourier Transform is then taken to determine what frequencies are present in the signal. If there is a concentration of frequencies in the range 170-270 Hz, then a bee is present at that distance. The relative density of bees can also be determined by seeing the magnitude of power at a certain frequency after taking the Fourier Transform. A plot is then made of range versus time. This graph indicates where and for how long bees are present at a certain location.
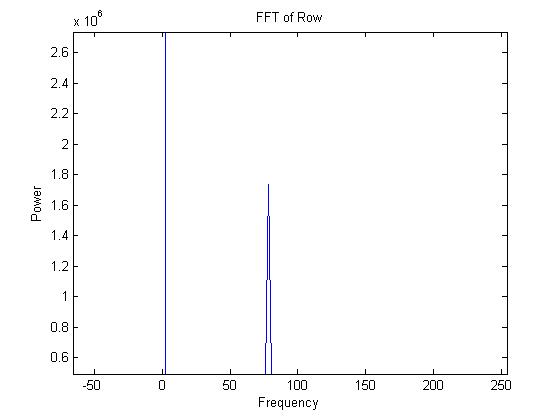
Plot of the Fourier Transform taken from experimental data containing an object moving between 73 Hz and 80 Hz

|


