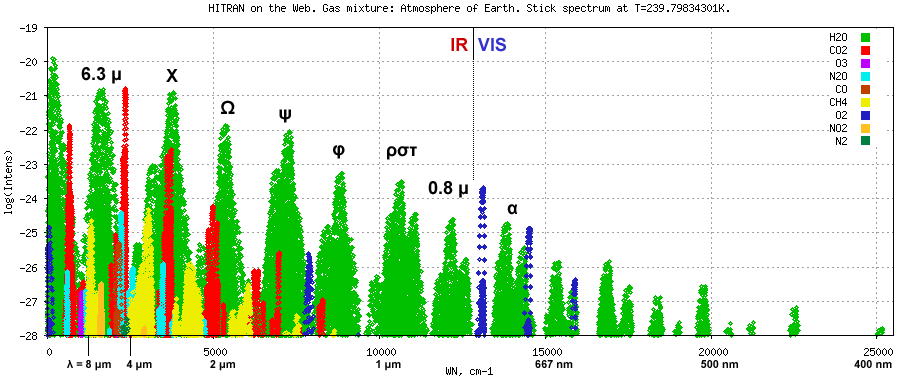


With growing concern due to climate variation, it is important to create measurement systems to monitor the presence and concentration of elements, molecules and particulates in the atmosphere. This team proposes the design of a low-power solar spectrograph that will measure the relative intensity of H2O Fraunhofer lines (absorption lines) in the atmospheric solar spectrum. Through the design of a durable weather-resistant system, long-term measurements of Fraunhofer lines will be collected at accessible or remote locations to monitor the changes in atmospheric gas concentrations.
Water vapor Absorption lines (Frounhofer Lines):
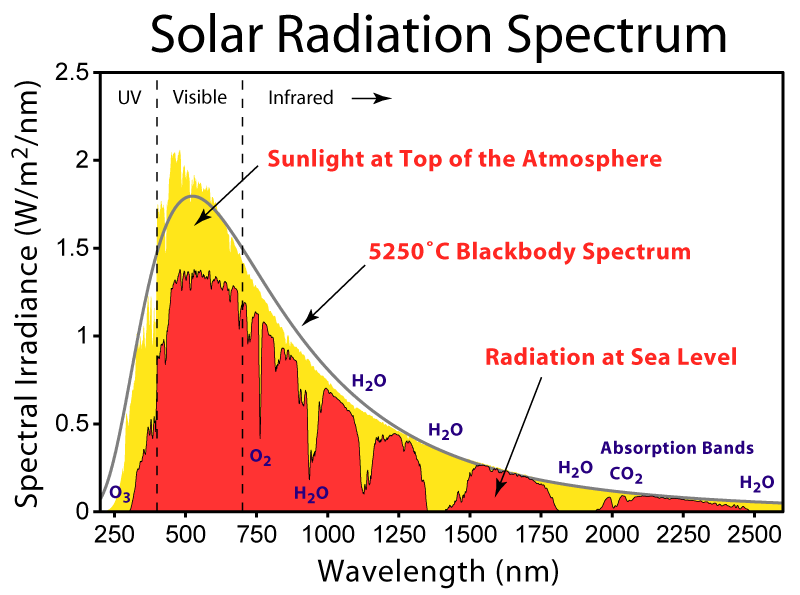
The sun which is often considered a black body radiator emits a broad
spectrum of radiation that travels through the earths atmosphere. The
plot below shows the total outer atmospheric sunlight (yellow) fits a
Blackbody spectrum curve. When the radiation has reached earths surface
certain wavelength ranges will have been absorbed by atmospheric gases
(red). Note that there is a large section missing around 800nm
labeled H20.


A Solar
spectrograph is an instrument that captures radiation from the sun and
separates this radiation into its individual wavelengths. With a known
spatial
separation of individual wavelengths spectrographs can be engineered to
accomplish a scientific goal. There are different variations of
spectrographs
however most share some specific characteristics to accomplish their
tasks,
these characteristics include capturing light from the sun, spatially
filtering
it through an aperture, collimation of the captured light, separating
the
wavelengths with a diffraction grating or prism, focusing of light onto
a
detector with a focusing lens or mirror. In this design a reflective
diffraction grating is used to separate the wavelengths and a focusing
lens is
used to focus the separated wavelengths onto a sensor. A CMOS sensor
was used
in this design instead of a photodetector which would require a motor
to scan
the individual wavelengths across the sensor.
The novel part of this spectrograph design is how the light is collected from the sun at various angles across and above the horizon. Generally, solar spectrographs light input slits or apertures are pointed directly at the sun. With this spectrograph design a light diffuser will be used to diffuse light incident at a maximum of 23o, such that enough of the scattered light is captured by the system. Holographic diffusers shape the diffusive light profile for higher sensitivity applications where higher transmission power is a necessity. A holographic diffuser set was obtained and tested for transmission and angular independence for this spectrograph system.
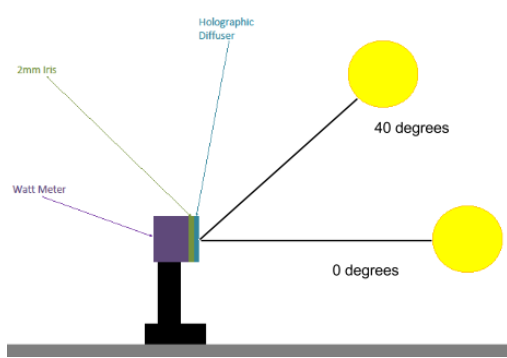
To test the holographic diffuser an open
faced optical power meter was used. A 2mm pinhole aperture was screwed
onto the
face of the detector such that the aperture remained approximately 1cm
from the
face of the detector. The holographic diffuser was then taped over the
pinhole
aperture where it remained approximately 5 mm away from the aperture.
A
protractor was taped to the center of the apparatus and by using a
ruler a 40
Watt light bulb was stationed 12 inches from the center of the
apparatus. A
two-dimensional diagram of the setup can be seen below. The light was
initially
held at 0o and moved up in 5o increments to 40o
while remaining 12 inches from the apparatus. This test was done with
two
different holographic diffusers, a 20o and 60o diffuser.
The rating of these diffusers is in regards to the maximum angle at
which they
will transmit optical power when light has normal incidence on its
surface. The
power relative to a control group incident on the detector was measured
and
plotted in Matlab. The control group was defined as the light bulb
normally
incident on the system with no diffuser blocking any light. These
values can be
seen over the range of input angles in the plot below.

The diffraction grating could be
considered the most important component of the spectrograph system.
This
importance is reinforced by the fact that it has been
mentioned so much in earlier sections. Without some type of grating or
prism
there would be no way for light to be separated into its individual
wavelengths. The three gratings that were considered for this design
were the
Richardson 53-*-260R, 060R, and 290R reflective diffraction gratings.
The
grating that was selected from the three options was the 260R grating
with 600
grooves/mm and 8.6o blaze angle. The efficiency for this
grating can
be seen below.
The minimum optical power required for
the CMOS sensor chosen for the system is specified to be 2nW/mm2.
In
the holographic diffuser test the diffuser efficiency at the most
extreme angle
seen in this system (23o) is approximately 20%.
This empirically
observed parameter is shown below in the Parameters
section below. Additionally, sun approximate
specifications, slit and camera area, and grating and camera
efficiencies were
taken into account at the center wavelength (800nm) for the purposes of
the
power budget calculations. The calculation flow and calculations below
show
that the theoretical intensity incident on the camera is 31.8nW/mm2.
This value is greater than the minimum camera specification, and it was
therefore shown that the system should function correctly with a
holographic
diffuser at the input. These calculations do not take into account
additional
power collected from a cylindrical lens, or power lost inside the
spectrograph
system.
Spectrograph Design:
A collimating
lens will be placed the focal length, 30 mm away from the slit. The
focusing
lens will be place about 8 inches from the face of the grating with the
sensor
placed at the focus, 30 mm. The lens is placed 8 inches from the
diffraction
grating face because it will take around 8 inches for the diffracted
rays to
clear the incident collimated beam. This also sets the distance between
the
collimating lens and diffraction grating to be at least 8 inches. The
focusing
lens will be angled at 10.6o such that all of
the 800 nm rays are
captured at a normal to the focusing lens. This will result in the 800
nm
wavelength of light to be focused in the middle of the CMOS sensor. It
is
inherent that not all of the light reflected off of the grating will be
captured by the focusing lens as the spot size incident on the grating
is equal
in diameter to the focusing lens. The beam then proceeds to elongate in
the
dimension of spectral spreading this causes vignetting of the slit
imaged
spectrum when a fraction of the beam is captured by the focusing lens.
This
results in the extreme wavelengths at 700 nm and 900 nm to have a lower
relative power on the sensor face compared to the 800 nm wavelength
which
should be entirely captured on the sensor. When the system is being
prototyped
an effort to maximize power captured by the focusing lens will be made
by
adjusting the incident angle of the diffraction grating such that the
focusing
lens can be moved closer to the grating, decreasing the effects of
vignetting.
A diagram of the Lens optical design layout can be seen below.


The
system housing
will be assembled using a metal frame in order to ensure stability and
a planar
system. Aluminum sheets will be cut to the desired dimensions. Then,
the sheets
will be bent and welded together in order to create the housing box and
frame. The
box must be designed to be optically insulated. If any external light
enters
the system except through the optical slit, any optical power
measurements will
be compromised. To accomplish this optical insulation, the inside of
the box
will be painted with a low-reflection black paint in order to absorb as
much
undesirable light and reflected light as possible. The top and bottom
box
covers’ edges will be will be sealed with foam strips in order to
create a
system that is insulated optically and from moisture and weather. The
optical
components will be mounted on an aluminum mounting plate. The optics
will be
mounted on this aluminum plate using lens mounts, posts and post
holders from
Thor Labs. The slit and diffraction grating will be mounted on the edge
of the
box, as opposed to mounted internally as shown in the figure. This will
help
minimize any additional light entering the box. Currently, the slit
aperture is
specified to be 5.32mm tall and 50um wide. This size will accommodate
the
height and power specifications of the camera. The slit may be widened
to
increase power while sacrificing resolution, or narrowed for the
opposite
effect.
This budget does not include costs that
will factor into construction of the optical system housing. However,
there is
room in the budget to account for the creation of the housing system.
Specifically, 160 dollars remain for housing construction.
Additionally, some
aspects of the design may be cut from the system. The optical post
holders are
not necessarily required. Instead, the optics could be mounted by hand
to
decrease price. While the post holders would make mounting simpler,
they are
not required. The most expensive element in the design is the CMOS
Camera. It
is required, however, because it is able to operate under low input
power
conditions, which will occur in this system. The diffraction grating is
supplied by Richardson Gratings free of charge, and does not count
toward the
budgetary constraint. Additionally, a laptop computer may be used
during the
competition to obtain and interpret data. The aluminum mounting plate
and other
mechanical aspects of the design will be machined and altered in
Montana State
University’s machine shop.